Data is only as valuable as your ability to understand it. That’s why we are incredibly excited to announce Analytics V2 a complete overhaul of our platform's reporting and visualization engine, designed from the ground up to give you deeper, clearer, and faster insights.
Here is a look at what’s new and how Analytics V2 will supercharge your workflow.
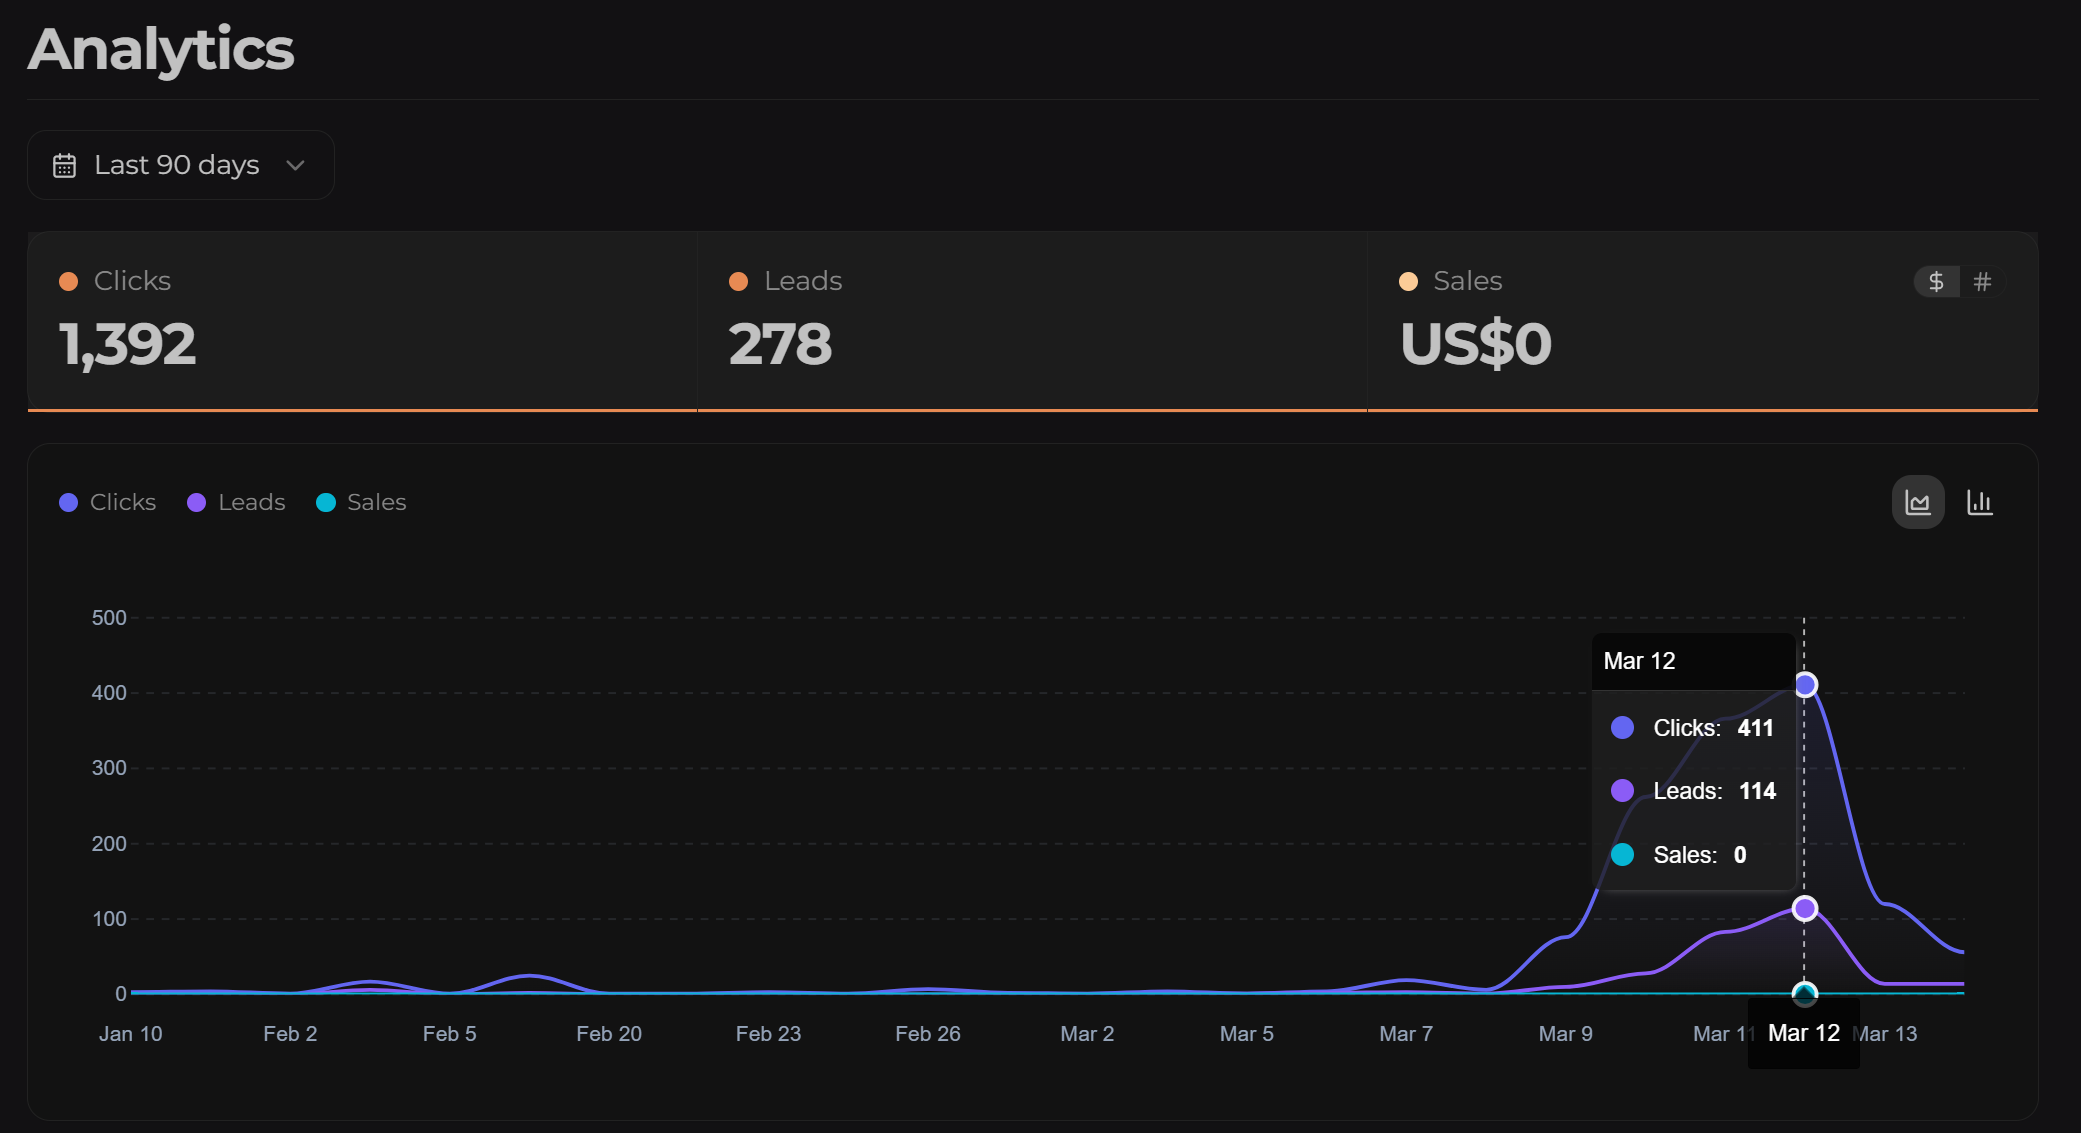
Focus on What Matters with Interactive Charts
One of the biggest improvements in V2 is how you interact with your data. We've introduced a tight integration between your quick-glance statistics and your deep-dive charts.
How it works: Simply click on any metric card (like Clicks, Leads, or Sales) at the top of your dashboard to instantly toggle its visibility on the main time-series chart below.
Want to compare just "Clicks" and "Sales"? Turn everything else off with a single click. This dynamic filtering lets you cut through the noise and spot correlations effortlessly.
Timezone Aware, Human-Readable Timestamps
Analyzing global data just got much more intuitive.
Previously, charts defaulted to 24-hour UTC formatting, which required a bit of mental math to align with your local day-to-day operations. Now, V2 automatically localizes all data points to your current timezone. Furthermore, we’ve switched the charts to a friendly 12-hour AM/PM format.
When tracking a spike in traffic, you’ll know exactly when it happened in your day.
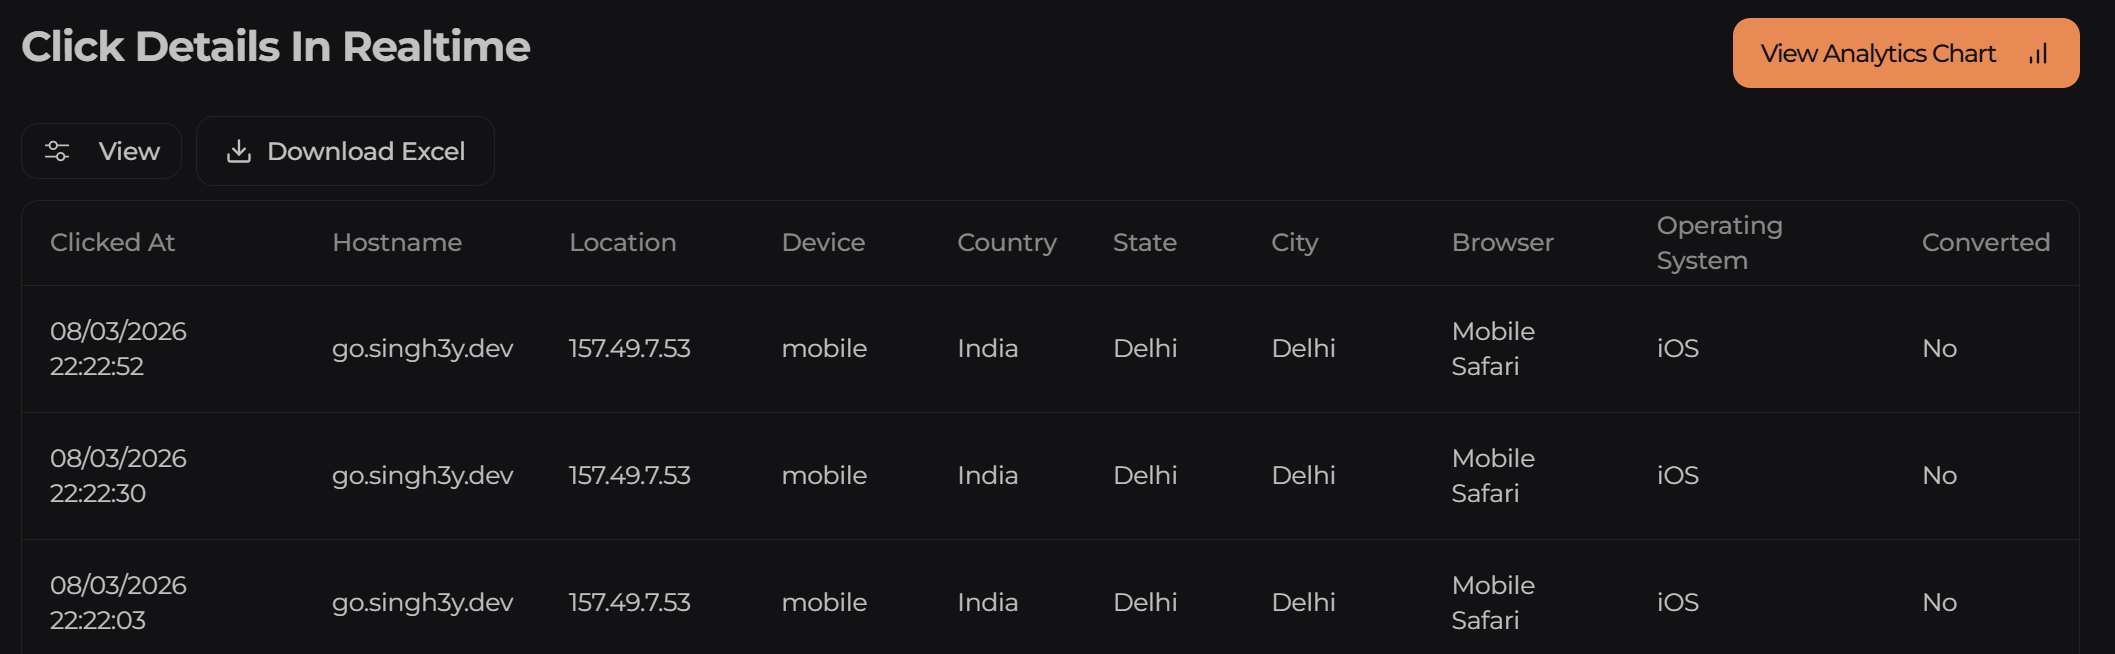
Infinite Excel Exports (Without the Duplicates)
Sometimes you just need the raw data to run your own advanced Pivot Tables or share reports with stakeholders. We completely rebuilt our export engine to handle massive datasets smoothly.
Full Dataset Retrieval: Clicking "Download Excel" no longer just grabs what's on the current page. The system automatically fetches your entire filtered record set in the background, paginating seamlessly until every row is captured.
Smart Deduplication: We handle the tricky parts of pagination boundaries for you. Our new intelligent deduplication engine ensures your exported Excel files are 100% clean and accurate, with no overlapping rows.
Ready-to-Read Dates: Epoch timestamps are automatically parsed and formatted into native, readable date strings natively within the Excel sheet.
What’s Next?
Analytics V2 lays the foundation for even more advanced reporting capabilities in the near future. This modular, highly performant update ensures that as your data grows, our platform will continue to deliver insights lightning-fast.
Head over to your dashboard today to give V2 a spin, and as always, let us know what you think!
Published with LeafPad